Friday, April 20, 2012

Cardio Lab


During our cardiovascular section of anatomy, we created a lab that questioned whether or not emotions affect our heart rate or not. Our hypothesis concluded that different emotions do in fact have different affects on our heart rate. It states that while watching a sad video clip, your heart rate would increase. During a scary video, your heart rate would also increase because of certain things like tension but, during a funny video, your heart rate will go down because laughing seems to be a calming mechanism. The last video we included in our experiment was a boring video. We believed that this would decrease the heart rate because of relaxation. After we developed our hypothesis, it was time to develop a procedure. In our experiment, we took two girls and two boys to make our experiment more accurate. We tested their heart rate while not watching anything and then we also tested their heart rate throughout the four categories of videos. Taking the data and putting it all together, each graph was different and included changes caused by motion and other factors outside of emotion. There was no direct data that concluded emotions actually significantly changed your heart rate. Therefore, we concluded that emotions do not have an affect of your heart rate like we originally thought.

Problem:

Does your emotional state affect your heart rate?


Hypotheis:

When your emotional state changes from watching different video clips it will affect your heart rate.
-Sad Video: We believe the heart rate will go up during a sad video because your body gets
a certain tension.
-Scary Video: We believe the heart rate will go up during a scary clip because your
adrenaline is pumping and your heart will be beating faster with anticipation.
-Humor Video: We believe the heart rate will go down because laughing tends to have a
calming effect.
-Boredom Video: We believe the heart rate will go down or stay the same because the body
will be relaxing with boredom


Materials:

  • Computer
  • Four different videos
  • Heart rate bars
  • Graph/data collector
  • Two girls
  • Two boys

Videos to watch:

  • -People running into glass doors - Humor
  • -College classroom - Boredom
  • -Mother and Sister dying - Sad with crying
  • -Scary video on youtube - Fear

Procedure:

1. Establish a base line heart rate.
2. In a private place set up the Heart rate monitor and videos with first person.
3. Play the scary clip while monitoring the persons heart rate to see changes.(each person
will watch a different scary clip that they haven't seen before to make sure the real emotion
comes out)
4. Play the humorous clip and measure the persons heart rate.
5. Play the sad clip and measure the persons heart rate.
6. Play the boredom clip and measure the persons heart rate.
7. Repeat steps 3-6 on next person. (the clips should be played in a random order so the
watcher does not know what to expect.)


Data:

A few examples of our data
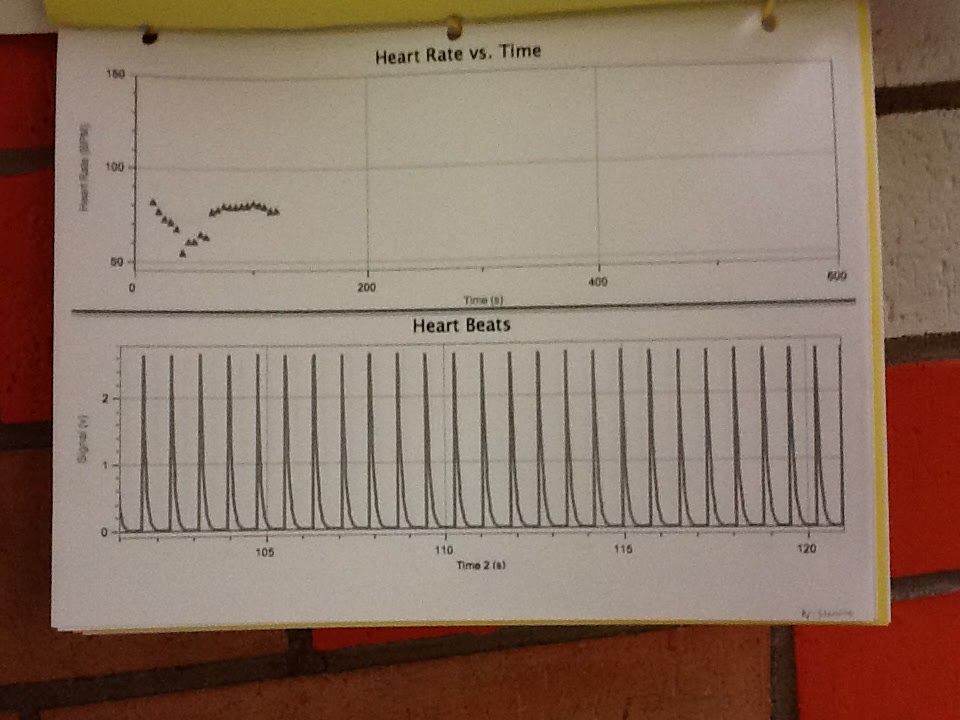
Nick's Standing Heart Rate

Nick - Sad
Nick - Bored
Nick - Scared
Nick - humor
Madison - Standing
Madison - Sad
Madison - Bored
Madison - Humor
Madison - Scared

Conclusion:

During our experiment, each and every one of our test subjects had different changes in heart rates. While watching no video, all of our subjects had changes in heart rate due to movement and other environmental factors, which insured that movement changed heart rate more than their emotions. During our video clip that was supposed to create a bored emotion and leave a stable or decreasing heart rate some of our subjects their heart rates dropped and went back up. In others, they began to rise slightly the entire time. During the video that was supposed to evoke a sad emotion our test subjects also had heart rates that didn't completely make sense according to our hypothesis. During one of our test subjects, the heart rate had an outrageous amount of outliers. The heart rate went up and down constantly. During others, it slowly rose. We also showed videos that we were supposed to evoke a laughing or happy/funny video. Our last video was supposed to make our test subject scared. Our test subjects were also similar and heart rates and all of the heart rates differed slightly. Therefore, we believe that emotions do not control your heart rate as much as we thought. We can conclude that heart rates do not have a factor in your emotions due to our data we gathered.


Friday, March 2, 2012

Pig Heart Dissection!

On Valentines Day
 (ironic I know! (: ) 
We dissected a pig heart!

Materials:
Pig Heart
Knife 
Pointer
Dissection Tray

Procedure:
Cut the heart in half (horizontal) 
Spread apart the heart so you can identify each part inside the heart

Parts of the heart: 
Aorta
Right/Left Atrium
Right/Left Ventricles
Interior/Inferior Vena Cava
Pulmonary Artery/Vein
Atrioventriclar Valve
Semilunar Valve
Mitral Valve
Tricuspid Valve


Below are some pictures of our procedure. 


Conclusion:
As we dissected the pig heart, we realized that the heart was very similar to ours. We share the same parts and it is relatively the same size. However, there were other people in the room the dissected a cow and sheep heart. These hearts differ in size. As you can imagine the cow heart is larger then a human and the sheep is slightly smaller. From this we can infer that the hearts (since they have the same parts and size) work the same. Therefore, this lab helped a lot because we could see the actual way a our heart works. 

Thursday, March 1, 2012

Research : Heart of the matter

Here is the link that will take you to the web address for my research article :) 

Have you ever heard of the cliche with heart attacks? You know, a man gets in a fight with his wife and falls over with a heart attack and ends up dead? Well scientists are actually proving this to be true! Crazy right? Now they are trying to figure something out that will save the lives of these heart attack victims. 

In fact, psychologists are trying to prove to the heart association that emotions such as stress, depression, anger, and social isolation contribute to heart attacks every day.  

In 1628, William Harvey actually linked emotions to the heart! He said that they affect the heart greatly. 
In 1897, William Osler (who is known as the father of internal meds) actually called the heart attack victim as a man who is always "at full speed ahead".
This actually influenced cardiologists in the 1950's to work with how emotions work with the heart directly. 

So why does this remain a controversy if everyone is working with it?
Last year, scientists did a study on 630 Army men and tried to link their anxiety with their risk for clogged arteries. They actually found that there was no link in emotions to their possibility to have clogged arteries at all! 

Even though some studies show emotion has no link with heart attacks, scientists still continue to work with it. A new study was conducted for older men and women to find out if anger specifically had anything to do with bad hearts.  During this they asked the subjects questions such as if they ever felt like hitting people when they were angry or if they considered themselves as an angry person. 
After four & a half years, William did a follow up with his patients and subjects. He found amazing results! The people with normal blood pressure and high scores on the anger scale were actually three times as likely to have heart problems then those with low anger. This was still true even after they controlled the subjects smoking, and eating habits. 

Emotions also play a role in recovery from a heart attack as well! Out of 896 people, the ones who were depressed after their attack were THREE times as likely to die then people who weren't! They also made another shocking discovery. Women were twice as likely to develop depression after a heart attack. Overall, 50% of women develop depression after a heart attack, whereas, only 25% of men develop depression under the same circumstances. This also goes for social interaction and support. If a patient has social support they are more likely to live then die. 

Since scientists have found this information, the National Heart, Lung and Blood Association is starting to fund places to research how they can improve the lives of people to prevent heart attacks and also improve their lifestyles after!

Wednesday, February 29, 2012

EKG

What does EKG actually stand for?
Electrocardiography.
EKG is an interpretation of the electrical activity of your heart over a certain period of time!
During this test, the doctors (or whoever is doing it) takes electrodes and places them on parts of your body such as your arms, legs, head, and stomach. Then, the recordings from the electrodes goes into a graph that is shown below!


The P Wave is the first wave on the EKG. It represents the span of electrical impulse through the atrial musculature. This would be activation or depolarization. 
The normal duration for the P wave is .11 seconds, 3mm in length, and it is positive.

Then comes the P-R interval. This is measured from the beginning of the P wave through the beginning of the QRS wave. What is happening here is the EKG is measuring the time it takes the heart to travel from the SA node all the way to the ventricular muscle fibers. The normal duration of this ranges from .12 - .2 seconds and is faster when the heart is beating faster. 

Probably the most important and complex of the EKG would be the QRS Wave. It represents the spread of impulse through the ventricular muscle or depolarization. If the first deflection if negative, it is then labeled the Q wave. The first positive wave is labeled the R wave (doesn't matter if it follows the Q wave). Then the second negative duration detected following the Q wave is labeled the S wave. This duration should not last longer then .05-.10 seconds.

The S-T Segment comes next and it always follows the QRS segments. This begins at the J(junction) point. The point that is measured is the elevation or depression and the shape is also examined. 

Last comes the T Wave! This represents the period of time it takes for the recovery of the ventricles. During this wave the direction, shape, and height is examined. 


This can be used for many things! Such as to detect abnormalities in the heart. If certain waves are longer then normal or abnormally shaped, doctors can examine the EKG to figure out exactly what the heart is doing that it's not supposed to be doing!

We actually had the chance to do this in class! Here is an example of one of the EKG's in the group that I worked with!

Tuesday, February 28, 2012

How The Heart Pumps Blood


How exactly does the heart pump blood and manage to keep you alive?
From the video above you can see how the normal heart pumps blood throughout the heart into the lungs; which keeps you alive and living every day, without even having to think about it! Amazing right?

So what exactly is the pumping of the blood called?
Blood pressure.
Blood pressure is a force that sends the blood through the circulatory system. Women normally have a lower blood pressure then men tend to do. Although, textbook perfect blood pressure is 128/80 depending on who you are, and what your blood pressure ranges, it could be a little different and thats okay. If your blood pressure does tend to get really high or low, they have certain medicines that can regulate it. The higher it is, the more your heart is working to get the blood throughout your body. This is not a good thing!

Before we get started here is a picture that shows what is going on and explains each part of the heart!


So lets talk about HOW blood flows throughout the body.
The heart consists of four chambers. Two atriums, and two ventricles. The atriums are found in the upper part of the heart and the ventricles and the two lower chambers. These chambers are what pumps the blood through the heart and into the blood vessels. The chambers are also split into two different sections: right and left. They do this for the purpose of where the blood goes into. The right side of the heart pumps blood into the lungs, and the left side pumps blood into the rest of your body! (So you can imagine that the left side is a LITTLE bigger (: )

Your body contains about 5 liters of blood and your heart pumps it all through your body about 70 times per minute! Therefore, this means that the heart has to go through one cardiac cycle in .8 of a second and afterwords take a slight rest! That's a whole lot of work for one organ in the body to do! Basically in .8 of a second the right and left atria contract, the right and left ventricles contract, and the atria and ventricles rest. The period of time that the heart is resting is when it allows the blood to drain from the ventricles because it is not contracting (this is called diastole). When your heart contracts, to get the rest of the blood from the atria to the ventricles, the ventricles are contracting to push the blood throughout the blood vessels (This is called systole). This cycle repeats, and repeats every second of your life!


Sheep Brain Dissection

During the nervous system, Madison, Chapin & I did a dissection on a sheep brain! Here are some pictures of each step we did.

Materials: 
Sheep Brain
Dissection Tray
Scalpel
Pointer
Scissors 
Our brain :)

Procedure: As you can see in the pictures below, we took our sheep brain and cut it coronal (horizontal all the way up the brain, from the top) 
We then separated each part of the brain to identify different parts in the brain and compare them to our brains. 


  You can see in this picture (above) the difference in the grey and the white matter in the brain. You can also see the brain stem, which is being pointed to.


Conclusion: 
The sheep brain was very similar to the parts in our brain. We have similar parts such as: the grey matter, white matter, brain stem, cerebellum, and they even look somewhat similar. So therefore, I can conclude that this dissection was very helpful because I can compare it to the way that our brain works and the different parts that have different functions!

Sunday, February 5, 2012

Leech Neurophysiology Lab

During the first few days of our new semester, we did an online leech lab
You might ask the purpose? Well, it was to educate us on Neurophysiology! So here we go.. :)

Materials:
  • Scalpel
  • Pins
  • Probe
  • Forceps
  • Scissors
  • Dissection Tray
  • Leech Tank
  • Feather
  • Leech Tongs
  • 20% Ethanol
  • Dissection Microscope
  • Micro-Manipulator
  • Oscilloscope 

Procedure: 
Step 1- Catch & anesthetize the leech in the 20% Ethanol
Step 2- Pin the leech (dorsal side up) onto the dissection tray and stretch the leech open
Step 3- Use the scissors to cut the skin along the middle of the dorsal side. Use the forceps to pull the skin from the incision and pin the that skin down to you can see the inside of the leech!
Step 4 - Remove the gut to expose the nerve cord underneath.
Step 5 - Cut a small piece under the ganglion.
Step 6 - Pin the piece skin side up.
Step 7 - Look at the piece through the microscope.
Step 8 - Use the electrode over the ganglion to simulate the process of penetrating the cell. The Oscilloscope will tell you if you found a cell or not. You can use the feather, forceps, and probe to see how each cell will respond. After you locate the cells, use the dye to see exactly where they are located. 
Step 9 - Use the UV switch to see each cell structure. 


Data:


 This is what I would call a P-Cell. 


This is what I identified as an R-Cell.
 
 
This is what I identified as a T-Cell


This is what I identified as an X-Cell.


This is what I identified as a N-Cell.


Conclusion:
This lab helped me understand how each of the cells work and it was interesting to find out how each one of them responded to each stimuli and how many cells there actually were. Each cell was actually located in a different region which also made it interesting to see how each one of them responded to each stimuli or didn't respond to certain stimuli at all. At the end, I can honestly say that this online virtual lab did help me bunches in learning how Neurophysiology works!


Friday, February 3, 2012

Concussions

Our group project on Concussions!

Wednesday, December 21, 2011

EMG Lab

EMG Lab: 
What is EMG? EMG is a graphical recording of electrical activity within the muscles.
When the muscles are activated by nerves it results in changes in ion flow across cell membranes. This generates electrical activity. During this lab, we tested the electrical activity within the muscles of your jaw while eating different types of food, varying in hardness. 

Hypothesis:
If we differ the hardness in foods, then the jaw muscles will show more electrical activity because the jaw works harder to chew harder foods then it does softer things.

Materials:
EKG probe and electrode tabs
Different types of food
Mouth :) (Someone to eat)

Experiment:
We hooked up Sierra to the probes to study her electrical activity. She had probes on her upper and lower jaw. First, we had a baseline (Sierra clenched her jaw and recorded the activity). Sierra rested her jaw for 5 seconds between each different types of food. We then gave her 8 different types of food (pudding, BBQ chips, carrots, chocolate chip cookies, a banana, celery, Dr. Pepper, & beef jerky)

Results:


Analysis:
As you can see, different types of food had different types of activity. The average activity was o.5 mV. The highest, surprisingly, was pudding with 2.2mV. We believe that the pudding had the highest amount of activity because the jaw moves more while trying to swallow the pudding because you don't have to chew as much. The lowest activity was Dr. Pepper. We believe this was because drinking liquids don't involve much of any activity. 

Conclusion:
We can conclude that our hypothesis is sometimes true, but not always. Celery is in fact harder then things such as Dr. Pepper, but this is not the case with celery and pudding. Even though our hypothesis was partially incorrect, we had a great time conducting the lab and actually learned a lot!!

Friday, December 16, 2011

Research - Muscle Regeneration :)


What are muscles responsible for?
40% of our body mass!
breathing
eating
posture
walking 
reflexes
heat generation 
metabolism

Muscle loss is called -  atrophy or wasting

Muscle loss causes:
disuse
injury 
starvation 
diseases such as cancer 
sepsis 
neuromuscular disorders
ageing

Muscle mass is reduced about 1/3 when humans reach the age of 50-80

The University of Western Australia 
has researched many things about muscles.. not only how they affect they body and also the heart as well

They took aged mice and this was exactly what they did!!
SOURCE: (http://www.anhb.uwa.edu.au/research/student-projects/muscle-regeneration)

Weights – Body weights, muscle weights
  1. Levels of muscle IGF-1 in young and old transgenic mice (IGF-1 elisa)
  2. Muscle fibre type changes (Immunostaining)
  3. Myofibre number and size (cross-sectional area) changes (HandE staining)
  4. Neuromuscular Junctions – morphology and innervation (Immunostaining and Imaging on Confocal lazer microscope)
  5. Motoneuron counts in the spinal cord (toluidine blue staining/developing other methods)
  6. Oxidative stress measurements
  7. Levels of neurotrophic factors (qPCR/mRNA levels/Western Blots)9. Signalling pathways – Phosphoprotein signalling (Western Blots)


Therefore, we can infer that the muscle anatomy in the body is very important. Without your muscles you would be 40% less of the person you are now, and stationary. You wouldn't be able to move, eat, or breath; pretty much nothing! This is why the research is so important especially in the elderly because when they loose muscle mass, they become weaker and fall more which leads to more fractures and even possibly death! Which is very scary! :/ The more you exercise, the more muscle mass you have and are able to do more things! So, go out and exercise and keep your self healthy in other ways! That way you don't end up old and unable to walk, or even eat!

Thursday, December 15, 2011

Muscle Anatomy!

While learning Muscle Anatomy, we broke ourselves up into different groups (Me, Madison, Chapin) to create our own version of Muscle Anatomy! It worked out very well actually. Here is our creation below!
Each group worked on Muscle Anatomy, Sliding Filament Theory (How we think muscles contract!), or Neuromuscular Junction.
Obviously, like said before, we worked on Muscle Anatomy!

The Big Picture! 
& below are different sections up close!